|
SIO Argo Site:
BGC SOLO Sensor Page
|

|
Serial= 4010 WMO= 1902368
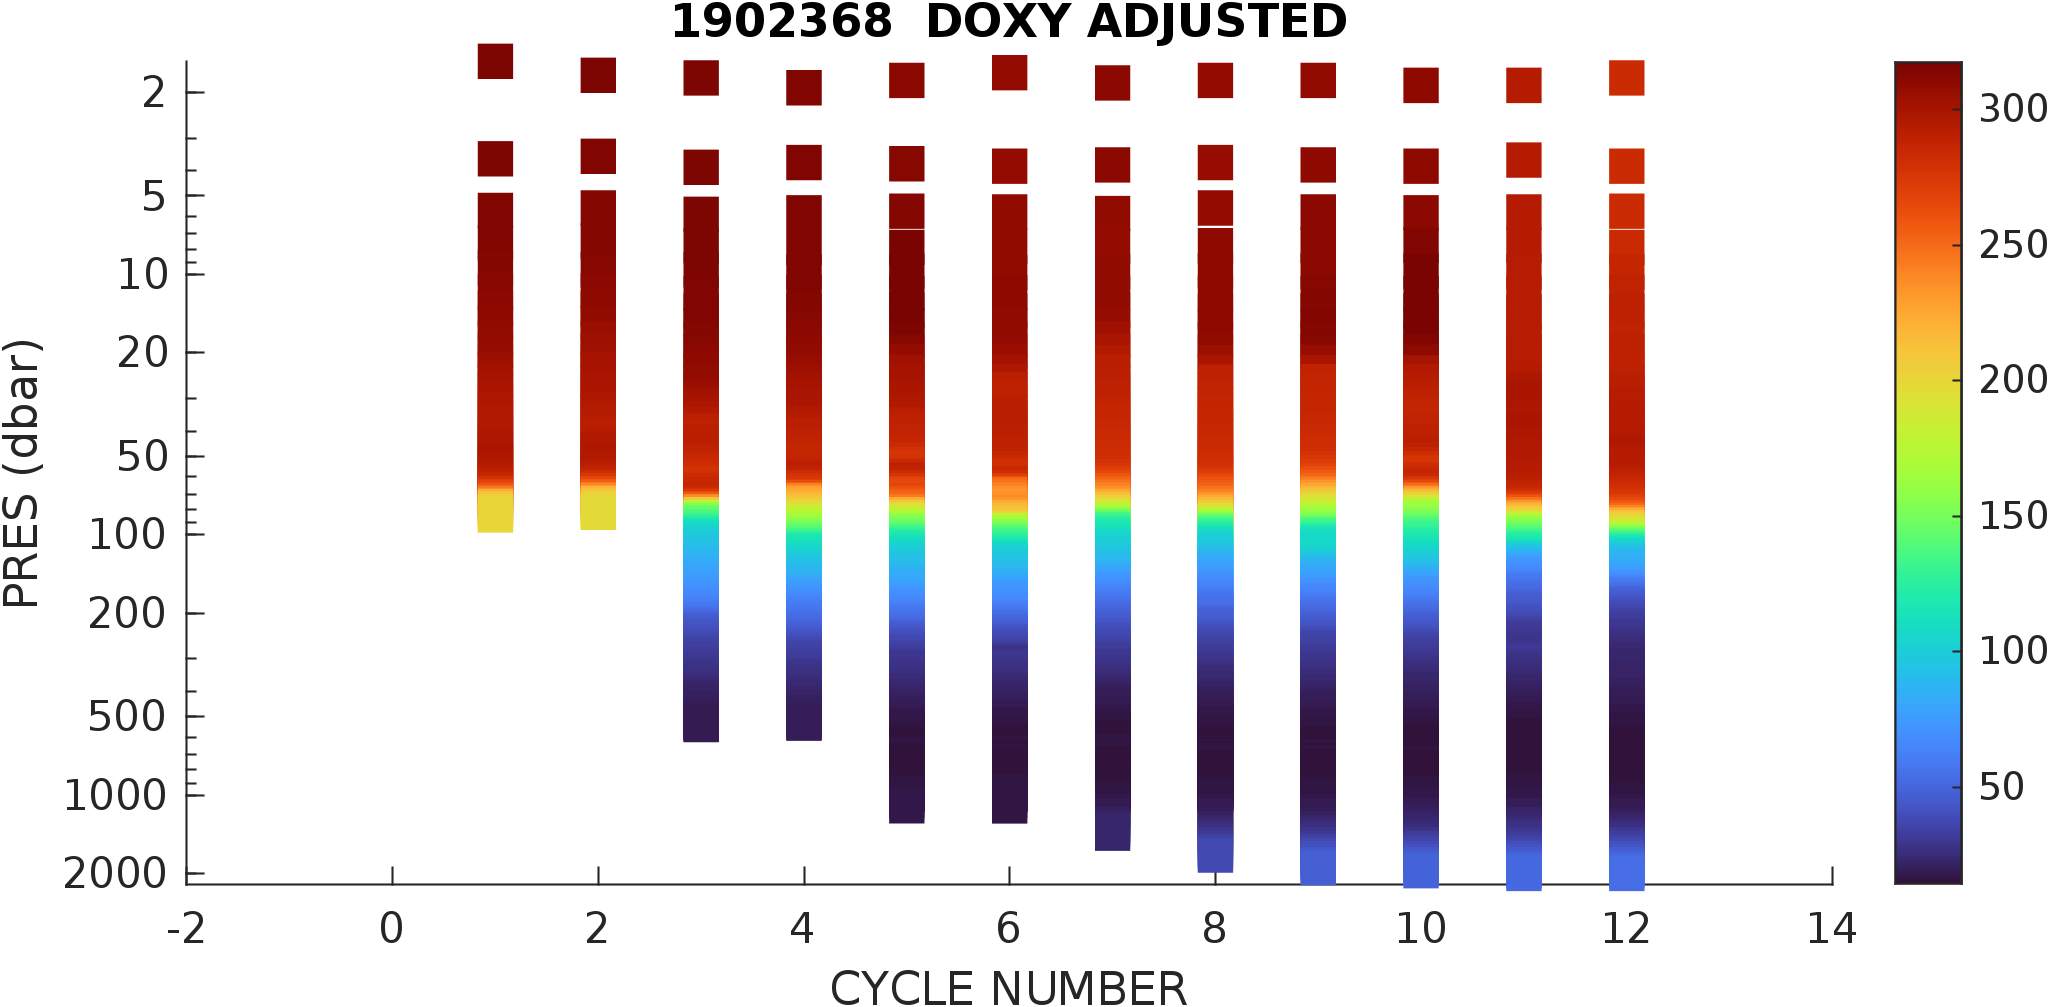
| Display of DOXY_ADJUSTED obtained from the Argo GDAC Sprof netCDF file. |
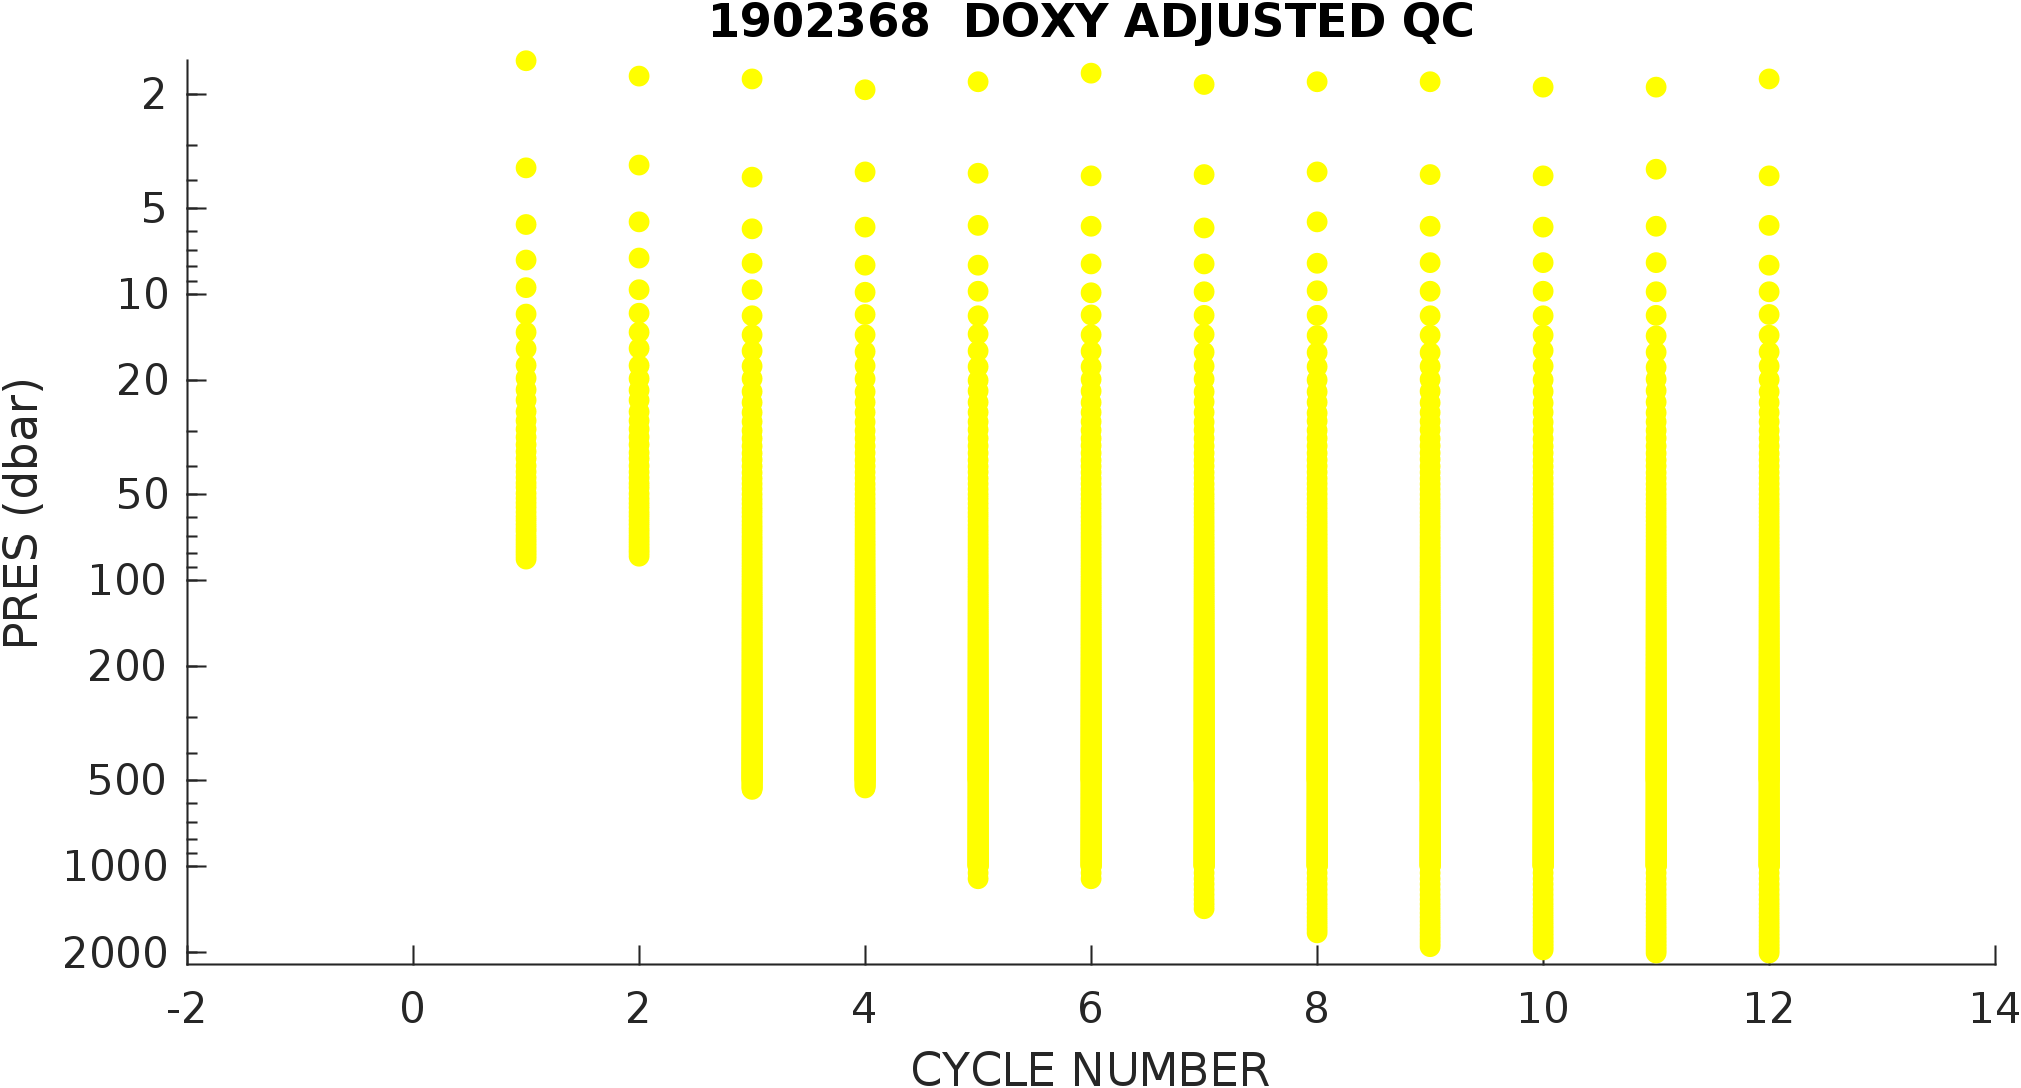
Display of the DOXY_ADJUSTED_QC flag obtained from the Argo GDAC Sprof netCDF file.
(blue: "good" QC=1; green: "probably good" QC=2; yellow: "probably bad" QC=3; red: "bad" QC=4;)
Bad flags, "3" and "4" are plotted last to accentuate the location of bad data. |
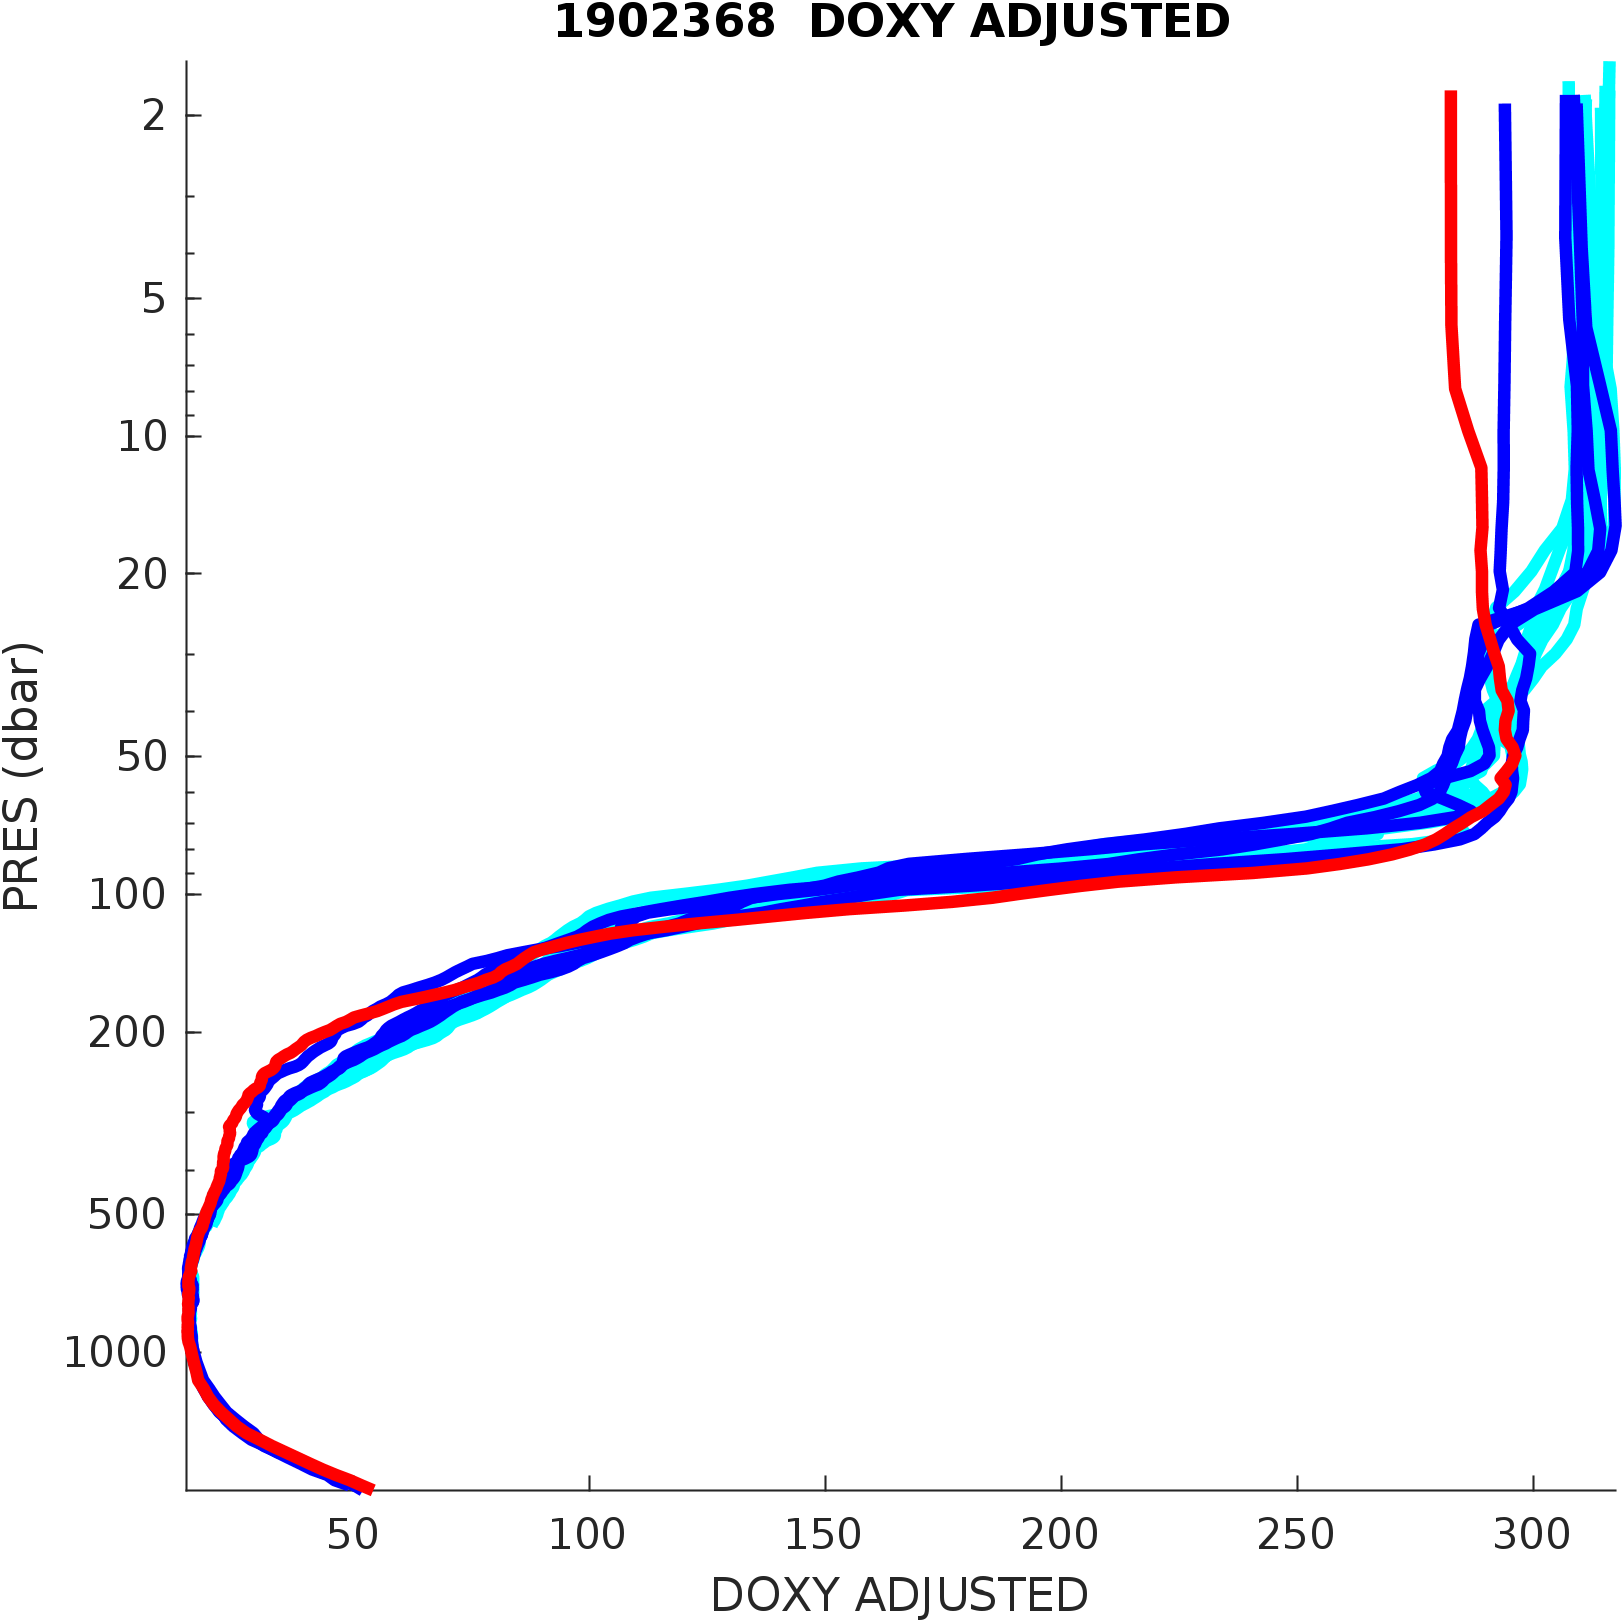
Display of overlayed DOXY_ADJUSTED obtained from the Argo GDAC Sprof netCDF file.
No data with QC of "3" or "4" are shown.
(grey: past cycles, cyan: last 15 cycles, blue: last 5 cycles, red: latest cycle) |
Display of the applied DM adjustment to DOXY obtained from the Argo GDAC Sprof netCDF file.
DOXY DM adjusment is a gain.
The colorbar is the pressure of the DOXY data.
If all pressures have the same gain applied, the greatest pressure color will be visible.
Data flagged as bad are shown with a red square.
|


