SIO Public Argo Site


|
SIO Public Argo Site |

|

|
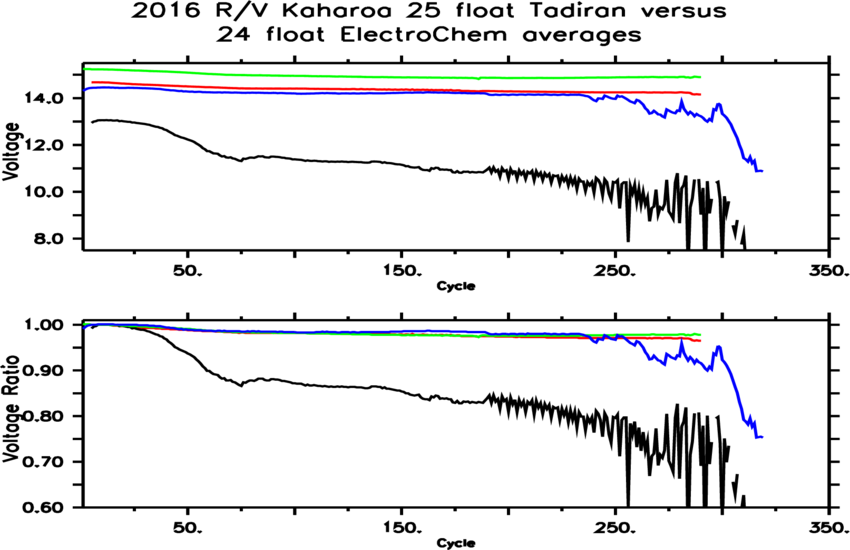
| The following figure compares the average buoyancy pump battery voltage versus cycle number from 25 floats with Tadiran batteries and 24 floats with ElectroChem batteries. All 49 floats were deployed from the R/V Kaharoa (08 Oct 2016 through 18 Dec 2016). Number of floats in a given cycle average may vary, especially in the latest cycles. These floats are programmed with a nominal 10-day cycle time which is standard for the Argo Program. Tadiran batteries Green: Voltage at surface Red: Voltage at deepest pressure and high load (nominally 2000dbar). Averages include only cycles with deep pressures greater than 1750dbar. ElectroChem batteries Blue: Voltage at surface Black: Voltage at deepest pressure and high load (nominally 2000dbar). Averages include only cycles with deep pressures greater than 1750dbar. The upper figure shows the recorded voltage (V). The lower figure normalizes the voltage by earlier values (Cycle 5 for the surface voltage, and Cycle 9 for the deep voltage). The differences shown in this figure are caused primarily by the choice of buoyancy pump battery. Differences between the two float groups from other sources are minimized with roughly equal numbers of floats in each average, having been deployed from a single cruise opportunity with float battery types alternated (roughly), and all floats having the same mission over their lifetimes. |

| Providing a longer timescale comparison, the following figure displays the buoyancy pump voltage and normalized voltage from float 8451 (Tadiran) compared to the 50 float ElectroChem average from the 2015 R/V Kaharoa cruise. Float 8451 was deployed in November 2015 and has typically performed cycles of 7 days, while the Kaharoa floats are programmed for 10 day cycles. The line colors are the same as in the above figure. |
| Another Tadiran equiped SOLOII float (serial number 8381) was deployed alongside 8451. This float has been programmed with short cycle times to 2000dbar, in order to show the long term behavior of the Tadiran batteries. The short cycle times makes comparisons to other floats challenging. The following figure shows the buoyancy pump voltage and voltage ratio from 8381. In the data record, quarter volt jumps in voltage from one cycle to the next is due to changes in the cycle time of the float. Longer cycle times (longer drift at park depth) results in lower pump voltages. However even these lower voltages are quite strong compared to ElectroChem batteries. |
| In 2017, 5 Deep SOLO were deployed successfully from the R/V Cook in the western North Atlantic. Three of the Deep SOLO were equiped with Tadiran and two with ElectroChem batteries. The floats are nominally programmed for 15 day cycles. These floats measure the full span of the ocean (0-6000dbar), offering another interesting comparison due to choice of battery. The lines in this figure are the same as above. As Deep SOLO floats profile on descent, the high pressure pump (Red: Tadiran; Black: ElectroChem) occurs at the end of descent from the surface, as the float rises towards drift pressure. Only deep measurements deeper than 4500 dbar are included in the average. |