Roemmich-Gilson
Argo Climatology


Latest Version: 2019 (Updated Jan 17, 2020) [Utilizing Argo data from January 1, 2004 through December 31, 2018]

The Argo Program has achieved 15 years of global coverage, growing from a very sparse global array of 1000 profiling floats in 2004 to more than 3000 instruments from late 2007 to the present. A basic description of the modern upper ocean based entirely on Argo data is available here, to provide a baseline for comparison with past datasets and with ongoing Argo data, to test the adequacy of Argo sampling of large-scale variability, and to examine the consistency of the Argo dataset with related ocean observations from other programs.

This new version of the Roemmich-Gilson Argo Climatology extends the analysis of Argo-only derived temperature and salinity fields through 2018. Several marginal seas and the Artic Ocean have been added. The analysis method is similar to what was descibed in the Progress In Oceanography Roemmich and Gilson paper (2009). The only modification has been to scale the zonal equatorial correlation of the optimal estimation step, by 8 times, versus 4 times as in the 2009 paper. The additional Argo data utilized in the analysis results in a longer monthly record as well as better estimates of the mean and variability fields. Monthly updates are available in between major biennial re-analyses.
Available for download from the ftp site:
2004-2018 RG Argo Temperature Climatology. [Warning: Download File is 663MB]
2004-2018 RG Argo Salinity Climatology. [Warning: Download File is 440MB]

station map

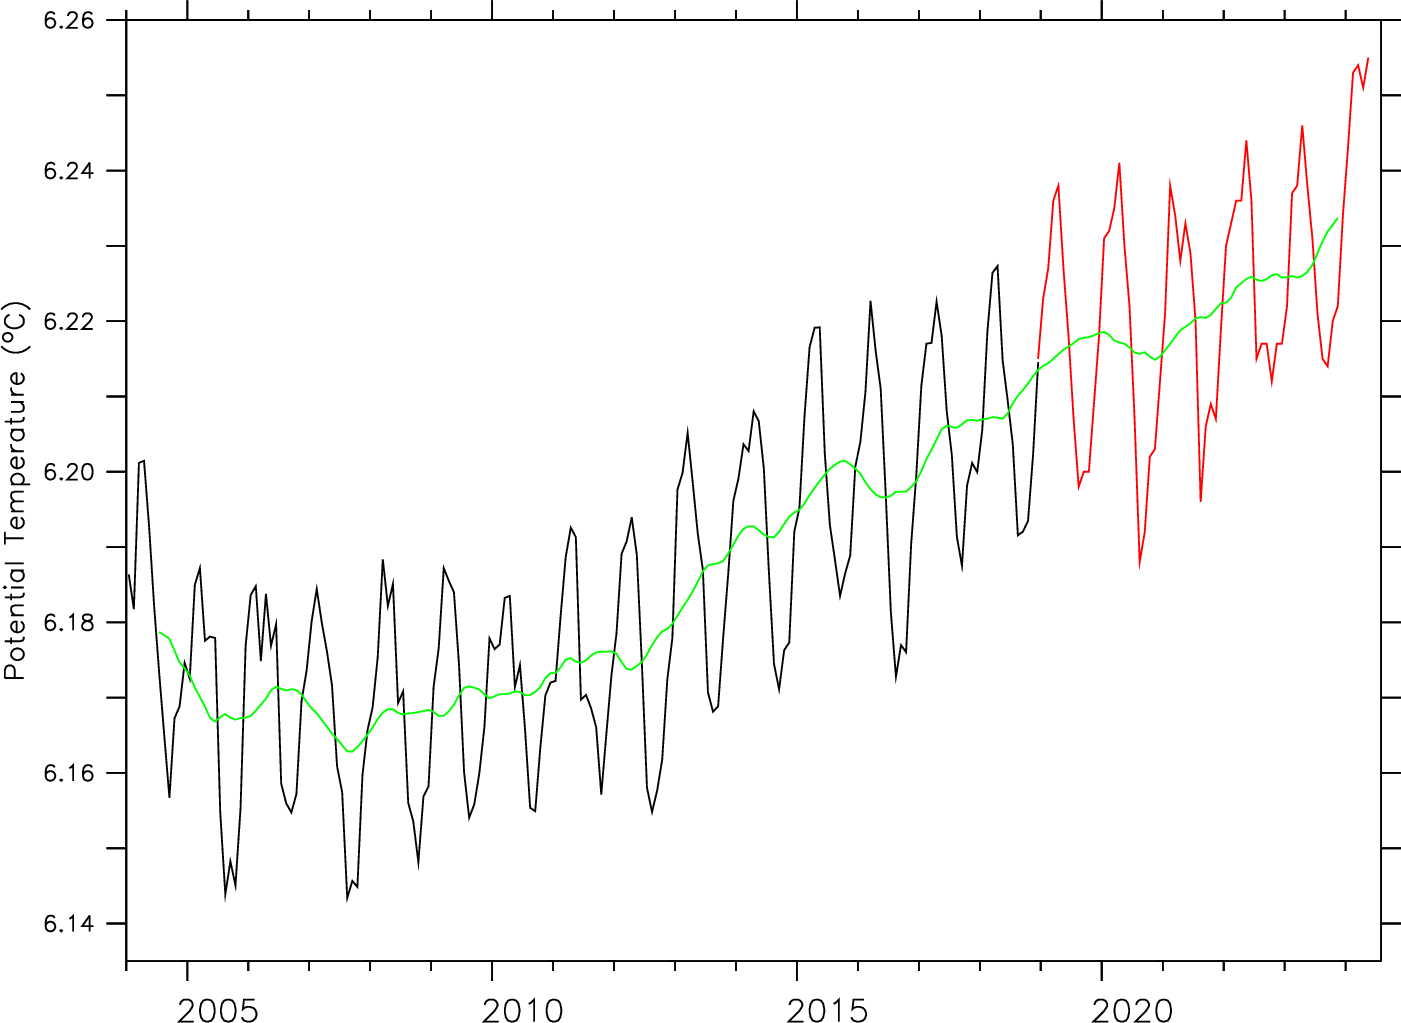
Timeseries of 0-2000dbar Global-Average Open Ocean Potential Temperature (oC) (Spatial mask defined within RG netCDF file. Marginal Seas and the Arctic Ocean are excluded from the calculation) over the 180 months of the RG Climatology (2004-2018) [black line] and 2019-2020 monthly extensions [red line]. The 12-Month box-car average is shown in green.

Note: The Argo array reached its 3000 float target in 2008. In the early years the array was insufficiently dense to 'cool' the monthly estimates from the 'warm' 2004-2018 mean+annual field used here as the initial guess.


2019 Monthly Extensions to the RG Climatology

Monthly updates temporally extend the RG Argo Climatology (2004-2018). Data from 2019 is not used in determining the most recent RG Argo Climatology (above).

Available for download from the ftp site: [RG Month (Creation Date)] -

January
(21-Dec-19)

February
(21-Dec-19)

March
(21-Dec-19)

April
(21-Dec-19)

May
(21-Dec-19)

June
(21-Dec-19)

July
(21-Dec-19)

August
(17-Jan-19)

September
(17-Jan-20)

October
(17-Jan-20)

November
(17-Jan-20)

December
(17-Jan-20)

[Warning: Individual Download Files are approximately 6.2MB]


2020 Monthly Extensions to the RG Climatology

Available for download from the ftp site: [RG Month (Creation Date)] -

January
(04-Feb-20)

February
(06-Mar-20)

March
(03-Apr-20)

April
(05-May-20)

May
(03-Jun-20)

June
(02-Jul-20)

July
(10-Aug-20)

August
(04-Sep-20)

September
(06-Oct-20)

October
(02-Nov-20)

November
(07-Dec-20)

December
(04-Jan-21)

[Warning: Individual Download Files are approximately 6.2MB]


2021 Monthly Extensions to the RG Climatology

Available for download from the ftp site: [RG Month (Creation Date)] -

January
(08-Feb-21)

February
(05-Mar-21)

March
(05-Apr-21)

April
(06-May-21)

May
(03-Jun-21)

June
(06-Jul-21)

July
(10-Aug-21)

August
(17-Sep-21)

September
(04-Oct-21)

October
(13-Dec-21)

November
(13-Dec-21)

December
(10-Jan-22

[Warning: Individual Download Files are approximately 6.2MB]


2022 Monthly Extensions to the RG Climatology

Available for download from the ftp site: [RG Month (Creation Date)] -

January
(17-Feb-22)

February
(15-Mar-22)

March
(11-Apr-22)

April
(16-May-22)

May
(06-Jun-22)

June
(20-Jul-22)

July
(04-Aug-22)

August
(13-Sep-22)

September
(07-Oct-22)

October
(07-Nov-22)

November
(16-Dec-22)

December
(09-Jan-23)

[Warning: Individual Download Files are approximately 6.2MB]


2023 Monthly Extensions to the RG Climatology

Available for download from the ftp site: [RG Month (Creation Date)] -

January
(06-Mar-23)

February
(06-Mar-23)

March
(10-Apr-23)

April
(07-May-23)

May
(07-Jun-23)

June
(04-Jul-23)

July
(07-Aug-23)

August
(05-Sep-23)

September
(03-Oct-23)

October
(09-Nov-23)

November
(06-Dec-23)

December
(06-Jan-24)

[Warning: Individual Download Files are approximately 6.2MB]


2024 Monthly Extensions to the RG Climatology

Available for download from the ftp site: [RG Month (Creation Date)] -

January
(06-Feb-24)

February
(06-Mar-24)

March
(09-Apr-24)

April
(06-May-24)

May
(06-Jun-24)

June
(06-Jul-24)

July
(05-Aug-24)

August
(08-Sep-24)

September
(06-Oct-24)

October
(10-Nov-24)

November
(06-Dec-24)

[Warning: Individual Download Files are approximately 6.2MB]


station map


Pressure averaged (0-2000dbar) Potential Temperature Anomaly (oC) from the latest monthly RG Extension. The Anomaly is defined relative to the RG 2019 annual cycle.


Increased Spatial Resolution Means

The RG Argo Climatology uses a weighted least-squares fit to the nearest 100 Argo profiles within a given month to estimate the mean field. This method can result in small spatial scale features being muted if the nearest Argo points span an area larger than the feature. By reducing the number of Argo profiles used in the least squares fit, smaller scale features can be retained with the tradeoff being larger uncertainties. Here are estimates of the temperature and salinity, 2004-2018 mean and 2004-2018 annual cycle fields, derived by using 1/3 the Argo profiles (nearest 33 profiles per month) in the least-squares fit. All other methods, including the optimal interpolation, remain the same as the RG Argo Climatology. The mean field (no temporal variablity) is reported at a resolution of 1/6 by 1/6 degree. The annual cycle is reported at a resolution of 1/2 by 1/2 degree.

Available for download from the ftp site:  2004-2018 1/6 x 1/6 degree mean field [t=0]. [Warning: Download File is 208MB]
Available for download from the ftp site:  2004-2018 1/2 x 1/2 degree annual cycle field [t=1:12]. [Warning: Download File is 289MB]

Support

The files available at this website are in netCDF format, a binary storage medium. They are not CF compliant. Recommended tools to use and manipulate the files include the Global Marine Argo Atlas, Ferret, or Matlab.

For additional support, please contact John Gilson (jgilson@ucsd.edu).


How to acknowledge use of the climatology:

Roemmich, D. and J. Gilson, 2009: The 2004-2008 mean and annual cycle of temperature, salinity, and steric height in the global ocean from the Argo Program. Progress in Oceanography, 82, 81-100.

If using this product in a publication, please remember to acknowledge Argo data with the following statement and the Argo DOI.

" These data were collected and made freely available by the International Argo Program and the national programs that contribute to it. (http://www.argo.ucsd.edu, http://argo.jcommops.org). The Argo Program is part of the Global Ocean Observing System. "

Argo (2000). Argo float data and metadata from Global Data Assembly Centre (Argo GDAC). SEANOE. http://doi.org/10.17882/42182