 |
 |
|
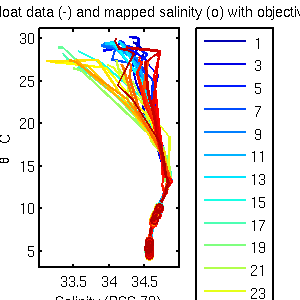
| Figure 1: Uncalibrated float measurements with historical estimates. (Click for larger image) | Figure 2: Calibrated float measurements with historical estimates. (Click for larger image) | |
 |
 |
|
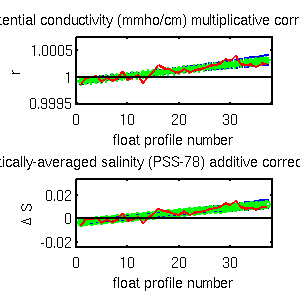
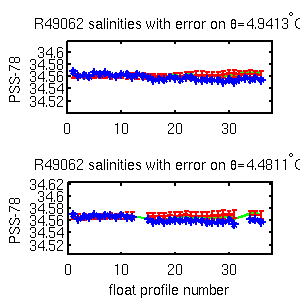
| Figure 3: OW time series of correction, in potential conductivity (top) and salinity (bottom). (Click for larger image) | Figure 4: OW time series of salinities on potential temperature levels. (Click for larger image) | |
 |
 |
|
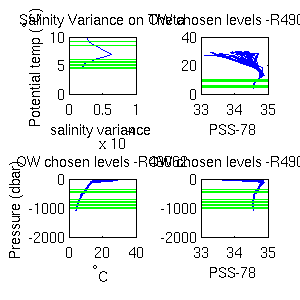
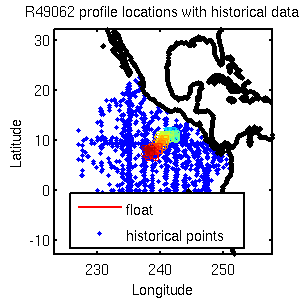
| Figure 5: Chosen levels in OW (Click for larger image) | Figure 6: Float spatial migration and historical data locations. (Click for larger image) | |
 |
 |
|
| Figure 1: Uncalibrated float measurements with historical estimates. (Click for larger image) | Figure 2: Calibrated float measurements with historical estimates. (Click for larger image) | |
 |
 |
|
| Figure 3: OW time series of correction, in potential conductivity (top) and salinity (bottom). (Click for larger image) | Figure 4: OW time series of salinities on potential temperature levels. (Click for larger image) | |
 |
 |
|
| Figure 5: Chosen levels in OW (Click for larger image) | Figure 6: Float spatial migration and historical data locations. (Click for larger image) | |